is a great platform to manage and orchestrate Docker containers. Although it started as a way to manage my Raspberry Pi’s, it can be run on any operating system that supports Node.js and Docker. PiCluster has been under heavy development lately and I like to share what is new in v1.9.
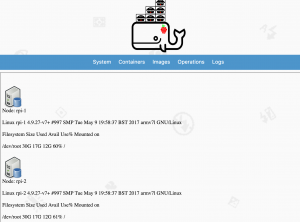
The Node status page has been completely redone. Instead of a text window showing you the nodes that are in the cluster, you will now be greeted with a more visual display that has icons and statistics for each node.
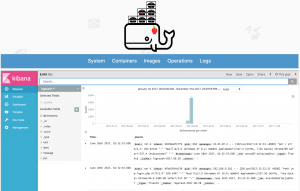
ELK stack is a very useful tool for system administrators to analyze data and log files. The Kibana dashboard is the graphical web interface used to run reports, graphs, and check logs. PiCluster can now embed the Kibana dashboard to provide administrators with a unified view to manage their clusters and logs. Kibana is accessible through the operations menu. To enable Kibana, add your Kibana endpoint in config.json:
"kibana": "https://127.0.0.1:5601"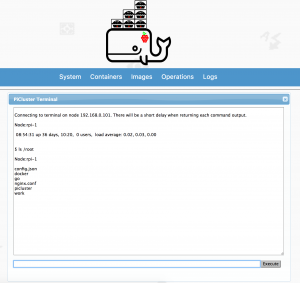
In previous releases, PiCluster could run shell commands on a single node or cluster wide. In this release, there is now an interactive terminal that can connect to any node in the cluster easily. This functionality makes it easier to handle more complex tasks that require entering a series of shell commands.
I hope that you try out PiCluster and enjoy the direction that it is heading. Feedback and feature requests are always appreciated. The best way to do this is via or .